# Variable importance
A **Variable Importance Score** in a machine learning model tells you **how much each input feature (or variable) contributes to the model's predictions.**
Essentially:
* **Higher score = More influential:** The variable has a greater impact on the model's output.
* **Lower score = Less influential:** The variable has less impact.
It helps you understand which factors are the key drivers for your model's outcomes and can be useful for feature selection (deciding which variables are most useful to keep).
{% tabs %}
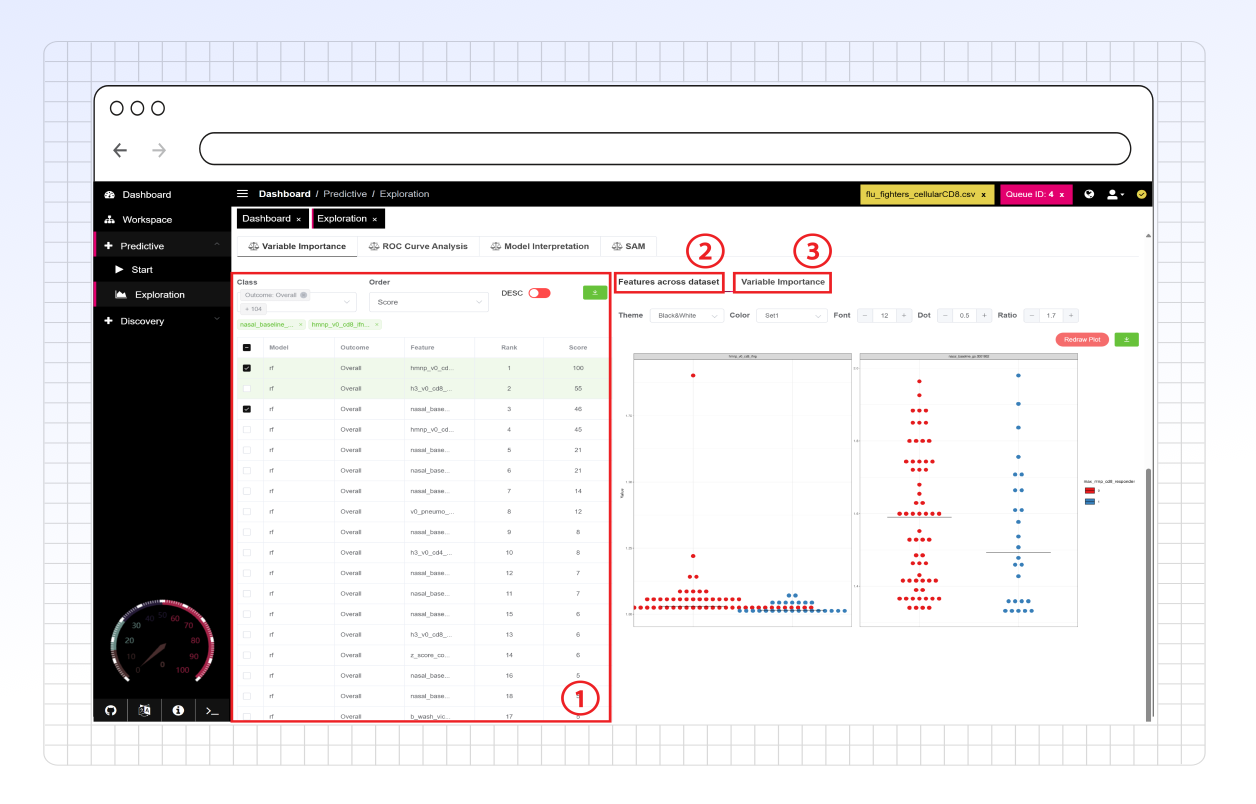
{% tab title="1. Feature Filtering" %}
**Feature filtering** allows the user to filter and select features to investigate features across the dataset and their contributions to the model's variance. The user has the following filtering options:
* **Class:** Only show features associated with predictions for the selected binary outcomes.
* **Order:** Choose to sort the feature table by various options, including but not limited to rank, name, and feature variance score.
* Toggle the adjacent switch next to sort in ascending or descending order.
* **Download:** Download an Excel sheet with the information shown in the table provided for all features.
{% endtab %}
{% tab title="2. Features across dataset" %}
The **Features across the dataset** sub-tab allows users to view the feature value distribution for each outcome from the base dataset (prior to training and testing). The feature values for each outcome are provided in the dot plot, and up to 25 features can be selected for these plots.
The plot display can be customized; see the [side panel options](https://atomic-lab.gitbook.io/pandora/data-analysis/discovery/side-panel) for more information.
The dot plots can be downloaded as SVG files or right-clicked and saved as a PNG in PANDORA.
{% endtab %}
{% tab title="3. Variable Importance" %}
This **Variable importance** sub-tab provides a bar plot showing feature importance in descending order. For Clarity, users can hover over bars to view the associated feature name and exact variable importance score.
This bar plot can be right-clicked and saved as a PNG in PANDORA.
{% endtab %}
{% endtabs %}