# Data overview
Use the **Data Overview** tab for an initial look at your dataset. Here you can inspect, filter, preprocess, and visualize specific columns before starting more complex analyses.
Main overview
{% tabs %}
{% tab title="Table Plot" %}
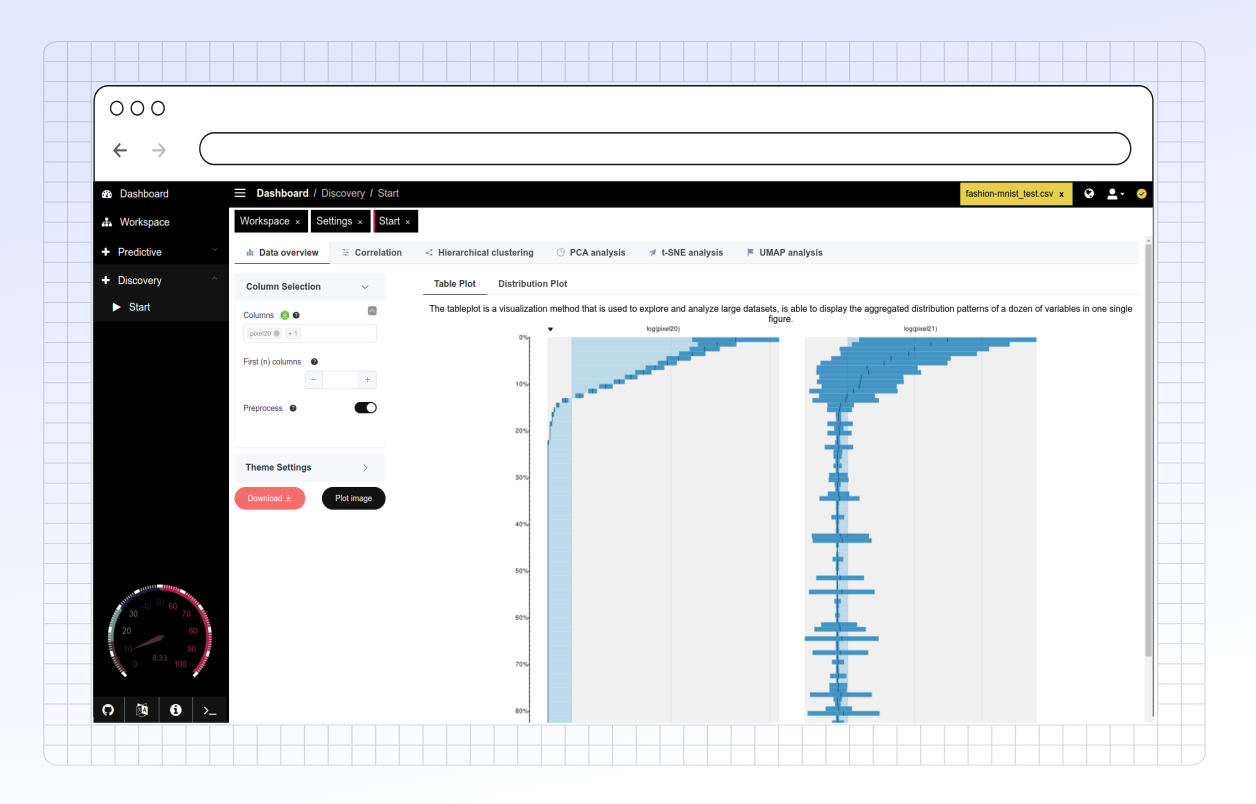
This plot visualizes the data in a tabular format, allowing users to examine aggregated distribution patterns across multiple variables.
Table plot illustrating the distribution patterns across the foldchange data of the hemagglutination inhibition assay (HAI) performed with various influenza virus strains
{% endtab %}
{% tab title="Distribution Plot" %}
Displays the distribution of values in selected columns, which helps in identifying skewness, outliers, and patterns in the data.
Distribution Plot
{% endtab %}
{% endtabs %}
#### Key Features
* **Preliminary Inspection:** Get a quick summary and visualize distributions for selected columns.
* **Side Panel Controls:**
* **Column Selection:** Choose which columns (variables) from your dataset you want to visualize.
* **Preprocessing:** Apply basic preprocessing steps like normalization or handling missing values directly here. (See Preprocessing Options for details).
* **Theme & Colors:** Customize the plot appearance using different themes and color palettes. (See Theme and Display Settings).
* **Download Options:**
* Download the currently displayed plot as an SVG file (scalable vector graphic, good for publications).
* Download the raw data subset currently being viewed (after any filtering/preprocessing applied in this tab).
* **Dynamic Activation:** This tab will only be active if your loaded dataset has sufficient data to display meaningful visualizations. This prevents errors with empty or very small datasets.
* **Bottom Information Bar:** When you select columns, this bar provides useful metadata about them:
* Count of unique values.
* Indication if the column is numeric (required for some analyses like PCA).
* Flag if the column has zero variance (`zv`).
* Percentage of missing values (NA).